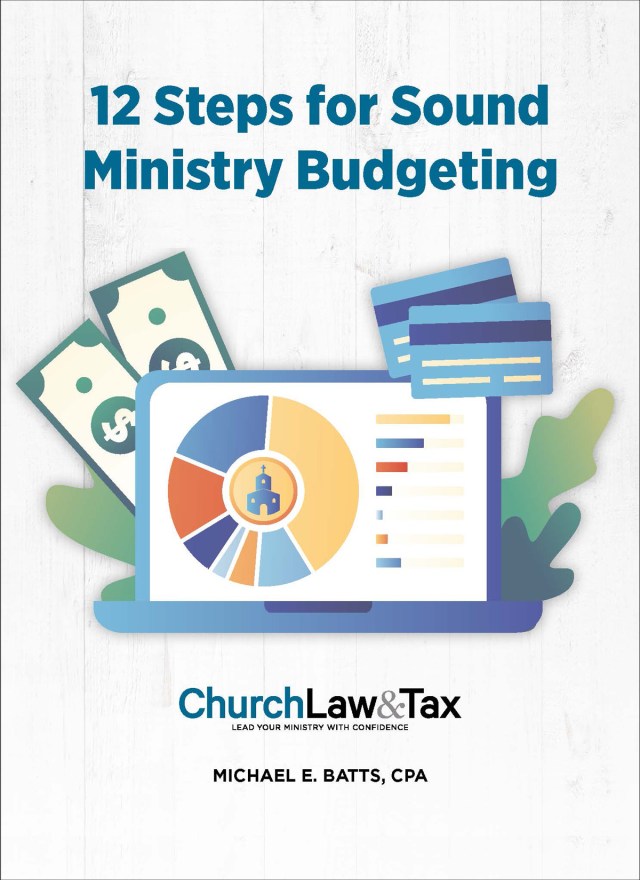
Does your church track its expense ratios? This can help you identify key trends in the outflow of resources between years. It also provides the opportunity to compare with other churches and check the reasonableness of your expenses. These ratios represent important indicators every church should understand.
1. Personnel and Mandatory Debt Service Payments to Total Expenses (Excluding Depreciation Expenses)
The ratio of “ Personnel ( Salaries + Benefits ) + Mandatory Debt Service Payments (Principal + Interest Expense)” to “Total Expenses – Depreciation Expense”
The largest expense on the financial statements of most churches is salaries and benefits. This is understandable, as a church is not in the business of selling products or manufacturing items. It provides services performed by individuals, paid and volunteer. Debt service payments—which are a reduction of a liability and not an expense—represent the second largest outlay. Together, these items represent a majority of resource outflows from the local church.
Therefore, it is essential to continually monitor these levels as a percentage of cash expenses. Cash expenses are total expenses less (minus) depreciation, the most significant noncash expense recorded. It is also important to promptly follow up on changes in trends or unusual variances from peers to ensure that your ministry resources are continually maximized.
This ratio, which can be split into two separate pieces, allows your church to look at two of its largest outflows and determine the portion of the operating budget that will be used. Often a growth cycle results in an amount of debt the church anticipates being able to pay off as more people are able and encouraged to attend. However, the church needs to be able to pay the bills and provide the services that will attract new people with the current budget. Reviewing this ratio in advance of any major debt decisions will help you analyze the feasibility of your facility expansion goals.
Reasonable benchmarks for these ratios, both individually as separate pieces and in the aggregate, are reflected in how churches actually spend their money. Those benchmarks are:
- Personnel costs (salaries and benefits) should fall between 40 percent and 55 percent of expenses.
- Mandatory debt service payments, including interest, should be no more than 15 percent of total expenses.
- Total personnel and debt service costs should be no more than 40 percent to 70 percent of total church expenditures.
2. Expenses (Excluding Depreciation) per Average Adult Attendee and Giving Unit
The ratio of “Total Expenses (Excluding Depreciation Expense)” to “Average Adult Attendees and Giving Units”
Has your church ever wondered what the cash cost is to the church for each adult attendee or giving unit? This measure provides the answer. It takes total cash expenses and divides that total by the average adult attendees or giving units.
This measurement uses the concept of a giving unit: a group of family members, or any recurring supporters of the ministry, that contribute jointly to the church. This excludes individuals who make a smaller, one-time gift supporting a specific event, such as a short-term mission trip. To identify only the regular recurring giving units, you must set a minimum dollar threshold, such as giving units that contribute more than $250 annually.
The power of this measure is in the peer group comparison. This allows your church to see if your cash expenses are high or low compared to your peers. Analyzing trends between years is also important.
Another benefit of this measure is that it can be subtracted from total contributions per attendee and giving unit to show if contributions are high enough to cover the monetary cost per individual. In other words, are you taking in enough contributions to cover the costs of having people attend your church?
3. Total Missions Categories to Total Expenses
The ratio of “Total (Local and Global) Outreach Expenses” to “Total Expenses”
This ratio looks at the combined total of local and global outreach (outside missions and benevolence) expenses as a percentage of total expenditures. Congregations report expenses for local and global outreach differently. Some churches tithe for their missions budget based on the offerings received.
This ratio can be separated into two pieces and calculated by local and global activities. Global activities include actual outside expenditures for cross-cultural missions activities in the United States and other countries. This includes direct support to missionaries; outside agencies, including national partners; and cross-cultural mission trips. It specifically excludes internally allocated costs and salaries of church employees included within missions for some church budgets. This is because internal allocations vary significantly between churches.
Local outreach includes actual outside expenditures for local missions activities not classified as “global.” This includes direct support of community-based church ministries, local missionaries and agencies, and benevolence given to local individuals. It also excludes internally allocated costs and salaries of church employees included within missions for the same reason as stated above.
Churches may find this ratio useful in benchmarking their total outreach expenditures with other churches. But more importantly, when a church experiences economic difficulties, the ministry and mission expenses are usually the first to be decreased as debt service payments are not discretionary and personnel costs are difficult to reduce. Declines in this ratio can allude to other issues within the church. Monitoring these ratios over time will allow the church to identify any significant changes.
4. Facility Cost per Square Foot (Excluding Interest Expense)
The ratio of “Total Facility Costs (Excluding Interest Expense on the Debt and Depreciation)” to “Total Facility Square Footage”
This measure answers the question “How much does it cost to operate my church building?” Total facility costs include building and grounds maintenance, personnel salaries and benefits, outside contract labor, utilities (excluding telephone), security, liability insurance, and rent or mortgage payments. It should also include the cost of general repairs to the facility and other facilities-use expenses, but not equipment purchases or the cost of major renovations. This overall expense excludes both vehicle-related expenses and interest expense on debt and depreciation.
Keep in mind that facilities expense measures can vary, depending on whether the church has new or older facilities and is in one or multiple locations. Facilities expense measures can also vary by geographic area. The most accurate comparison would be against churches with buildings of a similar age as yours (e.g., built within a decade of your own).
Monitoring Your Church’s Financial Health
Measuring and monitoring expense ratios and other key financial data will help your leadership team assess your church’s financial health, identify areas for improvement, and be good stewards of your resources. The four ratios and measurements outlined above provide a good starting point for monitoring trends in expenses, and additional metrics have been discussed in other columns.
Related articles: