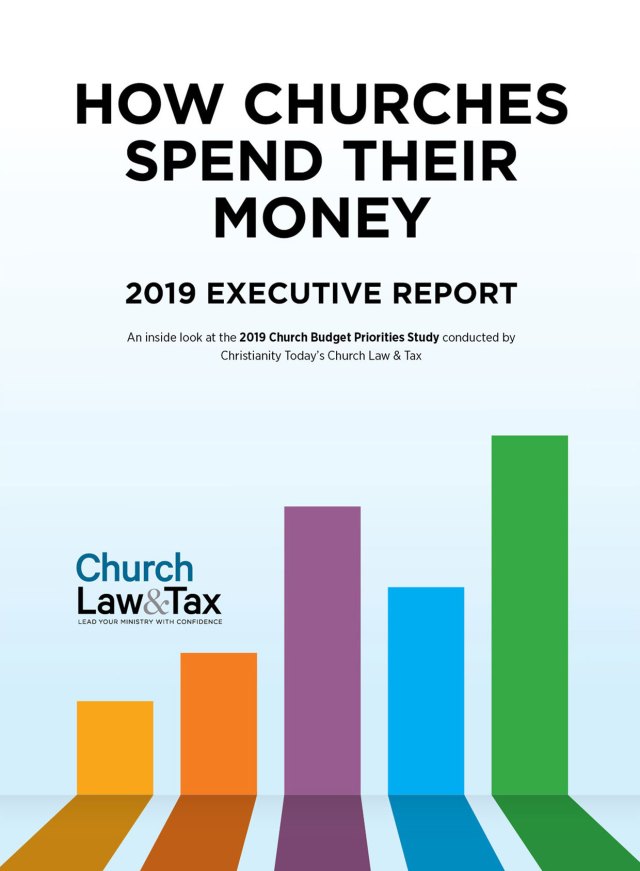
How churches spend money is a commonly-asked question here at Church Law & Tax.
It usually goes something like this:
We’re a small church in Florida. We’re trying to figure out how our spending on personnel compares to other churches like us. Can you help?
The specifics on how churches spend money on personnel always vary. The state differs, as does the church’s size. And while the inquiry often involves personnel expenses, it also looks for insights into other budget topics, such as expenses for buildings, missions, or ministry programs, and processes for approval.
Differences aside, the sentiment is the same. Church leaders like you appreciate the ability to compare their churches’ budget situations to others.
While the practice of making such comparisons isn’t perfect—each church’s situation is unique—it can prove useful when done right. For this reason, Church Law & Tax has conducted its church budget priorities survey periodically since 1999. “Such comparisons can help leaders discern whether what they spend on things like salaries, facilities, ministry programs, and missions, are too much, too little, or just right,” as I noted back in 2014, the last time the survey was offered.
Why is this project important? Aside from equipping you with the insights this information provides to individual churches, it also sheds light on broader trends. Over the past 20 years, we’ve determined some recurring benchmarks. We’ve also observed a few shifts.
Below are five notable highlights of these trends, broken down by year. But before we share them, please note these disclaimers:
- The methodology and line of questions have shifted over time. In 1999, the survey was entirely paper-based and targeted subscribers of various Christianity Today publications. In 2009 and 2014, the survey was entirely online-based, allowing a much wider net to be cast for survey responses. The more recent surveys have also delved further into general economic factors, something that wasn’t done in 1999.
- The respondent pools changed each time, so comparisons are not scientific. Only general observations can be made, and even then, caution must be exercised, given any number of variables that affected outcomes specific to the survey. For instance, the smaller net that was cast in 1999 likely contributed to smaller budget sizes when compared to 2014.
- The 2009 survey reported only median figures—not averages. Again, general indicators can be gleaned from this information, not hard-and-fast lessons.
- All actual dollar figures shown below were adjusted to 2019 dollars using the US Bureau of Labor Statistics inflation calculator.
1999
- Both the average and median budget sizes among the roughly 1,200 qualified responses was about $445,500.
- Personnel (salary and wages) represented the largest budget expenditure (40% of the average budget, 26% of the median).
- Facilities ranked second (18% of the average budget, 10% of the median).
- For sources of income, 93% came from tithes and offerings.
- For budget planning and approval processes, 73% said they used a traditional calendar year (January 1-December 31), rather than some type of alternative fiscal year (e.g., July 1-June 30). About 10% said their church spent one month or less on preparation and approval, 17% spent one to two months, 35% spent two to three months, and 35% spent three to six months.
2009
- The survey, conducted through a Christianity Today polling website, drew 1,800 qualified responses. The median budget size was about $350,000 (again, no averages were reported with this survey).
- Personnel was again the largest budget expenditure (38%).
- Facilities ranked second (12% of the median).
- For sources of income, 87% came from tithes and offerings.
- For budget planning and approval processes, 73% said they used a traditional calendar year (January 1-December 31), rather than some type of alternative fiscal year (e.g., July 1-June 30). About 6% said their church spent one month or less on preparation and approval, 12% spent one to two months, 20% spent two to three months, and 26% spent three to six months.
2014
- The average and median budget sizes among the nearly 2,200 qualified responses was significantly higher (again, note the disclaimer above). The average church budget was $937,400, while the median budget was $654,600.
- Personnel again was the largest budget expenditure (47% of the average budget).
- Facilities again ranked second (with 7% devoted to a mortgage or rent payment, 7% spent on utilities, and 5% spent on maintenance, cleaning, and landscaping in the average budget).
- For sources of income, 91% came from tithes and offerings.
- For budget planning and approval processes, 71% said they used a traditional calendar year (January 1-December 31), rather than some type of alternative fiscal year (e.g., July 1-June 30). About 7% spent one month or less on budget preparation and approval processes, 14% spent one to two months, 30% spent two to three months, and 41% spent three to six months.

